Are you gullible enough to fall for it? Someone says one thing, but means another. Twisting words and their meanings...That's called semantics.
Definition of Semantics:
example: Bill Clinton used semantics to wiggle out of hot water by pretending not to understand the meaning of "sexual relations" with an intern. Whether you hate him or love him, it worked.
another example: We bet your kids have tried it. Suuure their room is clean... just as long as you don't look under the bed or at all the stuff they crammed in their closet. Suuure they ate their vegetables... if you count one niblet of corn and half a green bean.
Is it lying? Well, ask yourself the opposite question: Is it truthful?
The Tennessee Department of Education, politicians, and reformers use semantics, too. They deliberately use words to convince people of something that is not truthful. Unfortunately, their scheme is working. How do they do it? They simply say that students aren't proficient. Proficient. That is the key word right there: Proficient.
Definition of Semantics:
- the study of meaning.
- the study of linguistic development by classifying and examining changes in meaning and form.
example: Bill Clinton used semantics to wiggle out of hot water by pretending not to understand the meaning of "sexual relations" with an intern. Whether you hate him or love him, it worked.
another example: We bet your kids have tried it. Suuure their room is clean... just as long as you don't look under the bed or at all the stuff they crammed in their closet. Suuure they ate their vegetables... if you count one niblet of corn and half a green bean.
Is it lying? Well, ask yourself the opposite question: Is it truthful?
The Tennessee Department of Education, politicians, and reformers use semantics, too. They deliberately use words to convince people of something that is not truthful. Unfortunately, their scheme is working. How do they do it? They simply say that students aren't proficient. Proficient. That is the key word right there: Proficient.

What does that word, "proficient," mean to the average person? Well, most people think it means that a student has at least a basic level of understanding to pass a test, right? Most people assume that if a student is deemed proficient for a grade level, that student passed and is ready to be promoted to the next grade. This leads people to assume that if a student is not proficient or scores below proficient, then the child has failed and needs to be held back to repeat the grade. When it is applied to standardized testing, people naturally assume things.
For example, when you hear or see a scary statistic from a Tennessee politician or reformer like this:
"Only 43% of 3rd graders scored Proficient or above on the 2015 TCAP test!"
You automatically think: "Oh my goodness only 43% of them passed, which means means that 57% of third graders are failing! That means 57% of 3rd graders can't pass a Reading Test! That means those children can't read!!!" Thus, people are easily convinced that something drastic must be done like: (insert the reform that benefits the politicians or reformers like: Common Core, more standardized testing, computerized intervention replacing teachers, firing teachers, getting rid of teacher unions and teacher associations, giving public schools to private charter operators, legalizing vouchers so that kids can escape these scary low test scores, data mining student's personal information without parental consent to find out why they aren't passing the tests, etc.)
Stop. Just hold your proficiency horses. Let's take a look at those Performance Levels on the TCAP test for grades 3-8. We found this info on the TDOE website, but it is also on the TCAP result sheets that parents are supposed to get in the fall when they eventually receive their child's test results (You can click on the image to see the entire document):
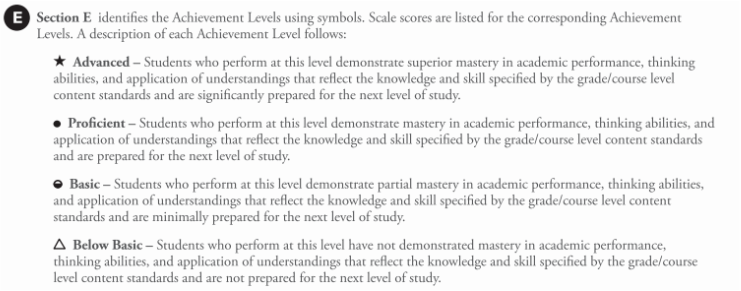
See how there are 4 different Achievement Levels? 4 different levels. That's important to know and something the politicians don't mention. Now the TDOE and testing company admit these performance levels do not correlate to the typical A,B,C,D,F grading scale for school report cards, but since the method of setting cut scores is not transparent, nobody in the public really knows. But let's just look at each level. Note: these descriptions and comparisons are our own:
Disclaimer: Of course, not every student fits into those categories. We've all known kids, or are raising kids of our own, that somehow aced a test despite never paying attention in class or doing homework. And we've all known super-smart kids who bomb tests. So these descriptions certainly don't reflect any of that. Did you notice how many times we wrote, "generally," in our descriptions? Momma Bears have been preaching for a long time now that children are so much more than test scores, so please don't send us hate mail about how your child doesn't fit into those categories or how we're just bitter because our kids didn't score Advanced (because some of our kids did). Having said that, we will now return you to the original blog about the semantics shenanigans...
Politicians and the TDOE only mention 2 categories to the public (Proficient and Advanced). See this pretty bar graph on a poster they showed to the news media last week when they released TCAP scores?
- ADVANCED: (what many would consider an A+) Generally, these are the above average students who are probably in advanced or gifted programs. They are super at taking standardized tests and picking the right answers. The percentage of students that fall into this Advanced category is small as you'll see in the chart below. Again, since the process of setting cut scores is not public, we can only suspect that this cut score is set high so that only a small percentage of students are classified as being in this category. Generally, most kids in this category are affluent and have a strong network of family support.
- PROFICIENT: (what many would consider an A or B) Generally, these kids are natural learners, self-motivated, good at taking tests, smart, and/or have parents who make sure they do their homework? As you will see below on the chart, this category is a much larger percentage of students than the advanced category, if not the largest for some. Generally, most students in this Proficient category eat 3 meals a day, get enough sleep each night, and probably have not been chronically hungry or in need.
- BASIC: (what many would consider a C) These kids passed. These kids passed! These kids passed!!! See that description in the image above? It clearly says these students are minimally prepared for the next level of study. They didn't fail! They didn't fail!! They didn't fail!!! Generally, students in this category are generally middle-class, borderline poverty, have special needs or disabilities, or are students who just generally don't test well. Generally. This is a large percentage of students compared to the other categories, as you'll see below. Again, these kids didn't fail the test and they are prepared enough, according to the state of Tennessee and the test manufacturer, to advance to the next grade. Sadly, some districts and teachers call these basic students the "bubble children" because they are the ones that need to bubble more correct answers to bump up to the Proficient category to make their district look better.
- Below Basic: (what many would consider a D or F) Unfortunately, these students failed. They are not prepared for the next level of study. Notice that like the Advanced category, it is quite a small percentage of students, if not the smallest category on some of the tests. Sadly, generally students in this category may be homeless, may not speak English, may have parents that work multiple jobs or be unemployed, may not have parents and are raised by relatives or in foster care, may have disabilities or special needs, may be dyslexic (or un-diagnosed dyslexic because 1 in 5 are), are victims of violence or dysfunctional homes, or just don't care about the test so they randomly bubble in answers.
Disclaimer: Of course, not every student fits into those categories. We've all known kids, or are raising kids of our own, that somehow aced a test despite never paying attention in class or doing homework. And we've all known super-smart kids who bomb tests. So these descriptions certainly don't reflect any of that. Did you notice how many times we wrote, "generally," in our descriptions? Momma Bears have been preaching for a long time now that children are so much more than test scores, so please don't send us hate mail about how your child doesn't fit into those categories or how we're just bitter because our kids didn't score Advanced (because some of our kids did). Having said that, we will now return you to the original blog about the semantics shenanigans...
Politicians and the TDOE only mention 2 categories to the public (Proficient and Advanced). See this pretty bar graph on a poster they showed to the news media last week when they released TCAP scores?
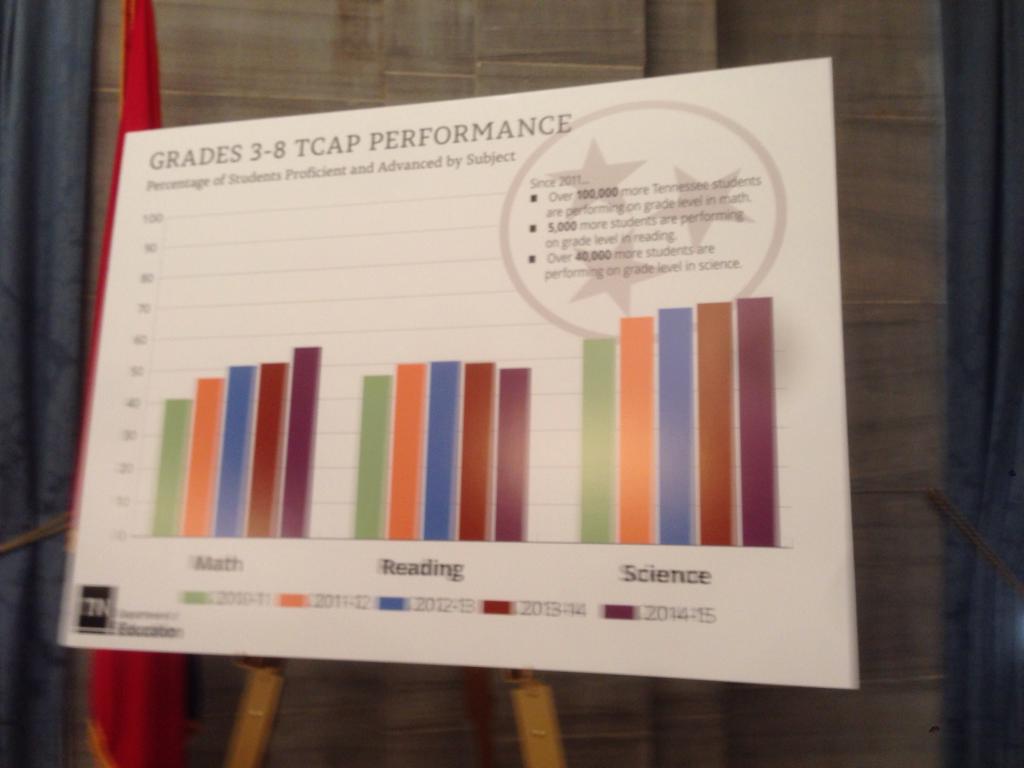
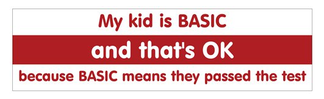
See underneath the title at the top of the picture in smaller font where it says "Percentage of Students Proficient and Advanced by Subject"? Hmmm... Why didn't they include the Basic kids??? Basic is passing! Basic is okay. Maybe we need a bumper sticker that says, "My kid is Basic and that is ok!"
Why would they be dishonest?
You may be wondering why politicians and/or reformers would do this kind of untruthfulness? To find the answer, you need to follow the money, honey. The politicians and reformers are trying to convince you that our public schools are in "crisis." There is money to be made from a crisis, lots of money, and change happens when there is a crisis. So, they show misleading charts and say scary statistics. They compare our state to other states and claim we are failing and falling behind (but they don't ever mention that the other states have less poverty, they fund their schools better than ours, they don't test every student, and those high-scoring states have strong teachers unions).
That's how we got into the whole Race to the Top mess. Reformers fed politicians untruths using the old "Proficient" category on the national NAEP test where Tennessee ranks low compared to other states. (The NAEP test also has the same 4 categories of scoring as the TCAP). It worked. Legislators were convinced enough to vote that money must be thrown at consultants, Common Core, and even more standardized testing to improve Tennessee's ranking. And legislators were convinced that Tennessee needs drastic measures like charter schools and vouchers to fix this make-believe crisis.
Okay, I believe you, but the failing students category is still not good
Some of you may be thinking, "there are still kids failing and that is not good enough!" You're right. We can do better. Students need smaller class sizes, more support from guidance counselors and specialists actually working in the schools, fully funded public schools, and proven methods of helping students learn instead of experimental computer programs. You must realize, too, that some students may never pass those tests because of disabilities, or not speaking English, or just not caring about a test so they bubble in random answers. Setting a goal of 100% of students passing (like No Child Left Behind mandated) is noble, but it is impossible unless those low-scoring students are kicked out of schools (like charter schools and private schools are allowed to do to inflate their scores).
What if every student passed? Hallelujah!
But what if every student did amazingly well on the standardized test? You know what would happen??? The cut scores would discreetly be moved on the tests before the results were announced, that's what. Because the politicians and reformers can't have a test where every student passes (except in Lake Wobegon, of course.) After all, the tests would be deemed too easy if students were doing so well on them. Don't believe us? Then what happened to the Social Studies TCAP test last year where every student in Tennessee passed? (Click on this link to see the proof that every student in grades 3-8 passed) Did you know that the TCAP Social Studies test wasn't even given this year and that it is being completely changed for next year to make it much, much harder? (weird side question to ponder: How did every 3rd-8th grade student in Tennessee pass the Social Studies TCAP test, but not pass their TCAP Reading/English test???) And what is TN about to spend $108 million dollars on next year? Yep, a brand new harder and more rigorous tests that will have an even higher failure rate for English, Math, and Social Studies. Say "hello" to the all new TNReady test, children.
You may be wondering why politicians and/or reformers would do this kind of untruthfulness? To find the answer, you need to follow the money, honey. The politicians and reformers are trying to convince you that our public schools are in "crisis." There is money to be made from a crisis, lots of money, and change happens when there is a crisis. So, they show misleading charts and say scary statistics. They compare our state to other states and claim we are failing and falling behind (but they don't ever mention that the other states have less poverty, they fund their schools better than ours, they don't test every student, and those high-scoring states have strong teachers unions).
That's how we got into the whole Race to the Top mess. Reformers fed politicians untruths using the old "Proficient" category on the national NAEP test where Tennessee ranks low compared to other states. (The NAEP test also has the same 4 categories of scoring as the TCAP). It worked. Legislators were convinced enough to vote that money must be thrown at consultants, Common Core, and even more standardized testing to improve Tennessee's ranking. And legislators were convinced that Tennessee needs drastic measures like charter schools and vouchers to fix this make-believe crisis.
Okay, I believe you, but the failing students category is still not good
Some of you may be thinking, "there are still kids failing and that is not good enough!" You're right. We can do better. Students need smaller class sizes, more support from guidance counselors and specialists actually working in the schools, fully funded public schools, and proven methods of helping students learn instead of experimental computer programs. You must realize, too, that some students may never pass those tests because of disabilities, or not speaking English, or just not caring about a test so they bubble in random answers. Setting a goal of 100% of students passing (like No Child Left Behind mandated) is noble, but it is impossible unless those low-scoring students are kicked out of schools (like charter schools and private schools are allowed to do to inflate their scores).
What if every student passed? Hallelujah!
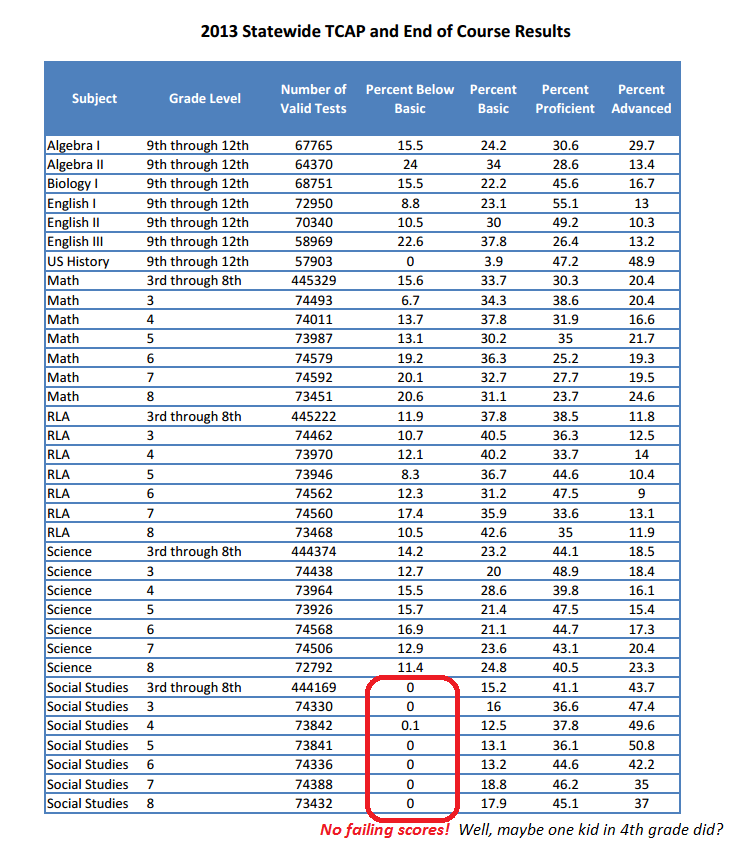
But what if every student did amazingly well on the standardized test? You know what would happen??? The cut scores would discreetly be moved on the tests before the results were announced, that's what. Because the politicians and reformers can't have a test where every student passes (except in Lake Wobegon, of course.) After all, the tests would be deemed too easy if students were doing so well on them. Don't believe us? Then what happened to the Social Studies TCAP test last year where every student in Tennessee passed? (Click on this link to see the proof that every student in grades 3-8 passed) Did you know that the TCAP Social Studies test wasn't even given this year and that it is being completely changed for next year to make it much, much harder? (weird side question to ponder: How did every 3rd-8th grade student in Tennessee pass the Social Studies TCAP test, but not pass their TCAP Reading/English test???) And what is TN about to spend $108 million dollars on next year? Yep, a brand new harder and more rigorous tests that will have an even higher failure rate for English, Math, and Social Studies. Say "hello" to the all new TNReady test, children.
Kinda like Russian Roulette with tests instead of bullets...
Another thing worth pointing out about cut scores and percentages, if a student (or school or district) improves his/her score to move up a category, then that means another student (or school or district) somewhere in the state gets bumped down a category. These cut scores and percentages are determined in such a secret manner that nobody knows how or why. And nobody ever really questions it. Here is an excellent link to how this monkey-business of tinkering with cut scores really works. In that link, you'll see some eye-opening graphs that explain how these categories, percentages, and cut scores are moved and manipulated, so, you should definitely read it after you finish reading our blog.
Back to the question you're all asking...
So how many students in Tennessee actually passed?
See for yourself on this chart we downloaded from the TDOE and added red ink to:
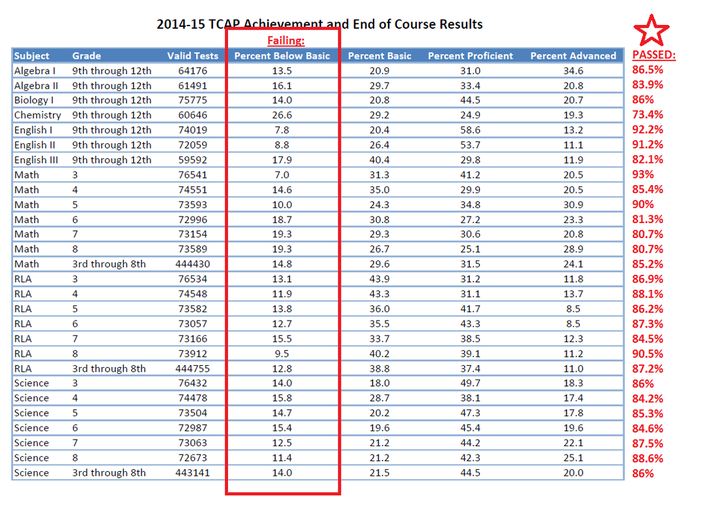
See? The sky isn't falling! Those are some high numbers for passing rates! Why isn't this a headline on the front of newspapers? Why aren't politicians throwing flowers at teachers, bestowing raises upon them, and kissing teachers' feet for this great news? You know the answer to that... it doesn't fit their agenda.
The public has been duped into believing that a scary high percentage of students are failing, when that is clearly not the case. Even worse this year, the Tennessee Department of Education used fishy math to determine the quick scores for student report cards. The fishy math is called the cubed root formula, and it inflated the low scores big-time. It was a sneaky way to fool parents into thinking the test is great because their own child scored so highly on it, and it also tricks parents into thinking that Common Core must be magically working. It is not truthful.
So now what?
Well, parents, now that we know the truth, what are we gonna do about it? The answer is that we're gonna tell others. Spread the news! Share this blog! Talk to your legislators! Tell them to fix this broken system. Tell them to listen to and trust teachers and parents. Tell them we need Testing Transparency in Tennessee! These tests carry too much weight to be manipulated like this. These tests should never ever be used to evaluate teachers. Some parents may wish to opt their children out of the tests. Tell your legislator to pass a law that will parents the explicit right to refuse/opt-out of tests for their children. Oh, and be sure to sign and share this petition calling for Testing Transparency in Tennessee. The testing system is clearly rigged. We won't fall for their semantics baloney anymore. They have lost our trust!
Well, parents, now that we know the truth, what are we gonna do about it? The answer is that we're gonna tell others. Spread the news! Share this blog! Talk to your legislators! Tell them to fix this broken system. Tell them to listen to and trust teachers and parents. Tell them we need Testing Transparency in Tennessee! These tests carry too much weight to be manipulated like this. These tests should never ever be used to evaluate teachers. Some parents may wish to opt their children out of the tests. Tell your legislator to pass a law that will parents the explicit right to refuse/opt-out of tests for their children. Oh, and be sure to sign and share this petition calling for Testing Transparency in Tennessee. The testing system is clearly rigged. We won't fall for their semantics baloney anymore. They have lost our trust!
